How to Use Analytics to Optimize Your Business
The ultimate goal of Queue Management isn’t only to manage queues.
This may sound contradictory, but Queue Management has more to offer (other than the queue management itself, naturally) and that is Queue, Flow, Service, Staff and Customer Analytics.
Adding a Smart Queueing System to your service is a start, but the key to achieving full customer satisfaction is by understanding what your customers want and the performance of your staff and locations. Once you have this covered you can see how this performance changes over time, and how it varies depending on how you adjust your changes.
Improve, Monitor & Forecast
Improvement is fuelled by Data.
Business Intelligence is necessary in every field, so commit to the evolution of the flow of your customers and get to know Bloom Data & Statistics.
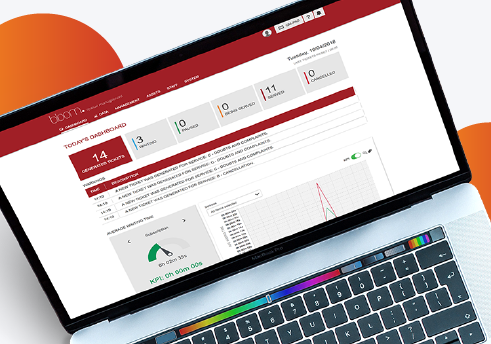
Bloom works as a true brain for your service management, gathering data from performance, tickets, appointments, staff, and forms.
To boost your business, you need to be able to read and analyse all collected data.
Monitor your performance in real time.
Check the need to open or close service branches and have an overview of all service statuses.
When you have hundreds of clients a day you won’t remember each contact you made! With our tool, you can check each interaction between customers and staff by generating charts of your:
- Tickets (their status, generated tickets, booked appointments, etc.)
- Customer Satisfaction by user
- User and device status
- Interactions
- Service details
Discover your service demands when you study the flow of your visitors.
Interactive charts display historical statistics and their variation over time, increasing the predictability of the number of visitors for optimized resource management and consequently a better service quality.
When you study your customer volume you know exactly your peak hours, the future possible ones and the potential barriers that need to be addressed.
It’s mandatory to follow the evolution of how long it takes for each customer to be called, served, or paused, by whom and much more so you can determine your KPIs per Service, Counter and or Staff member.
Some of our key features to help you with forecasting are:
- Service time variation
- Waiting time variation
- Ticket transfer flow
- No-shows and cancellations
Measure the Performance of all locations.
With Bloom, you can compare the performance between services, counters or users, and its variation across time.
In case you want to know if one branch is doing better than the other, you can:
- Compare service and user performance
- Generate automatic reports by email
- Export data for further analysis
You can either verify how your staff or each individual staff member is performing, and you can filter this data however you like. Know how many tickets and how much time per ticket your employees take, how many breaks they are taking and for how long, and how satisfied are your customers with them!
Listen to your customers.
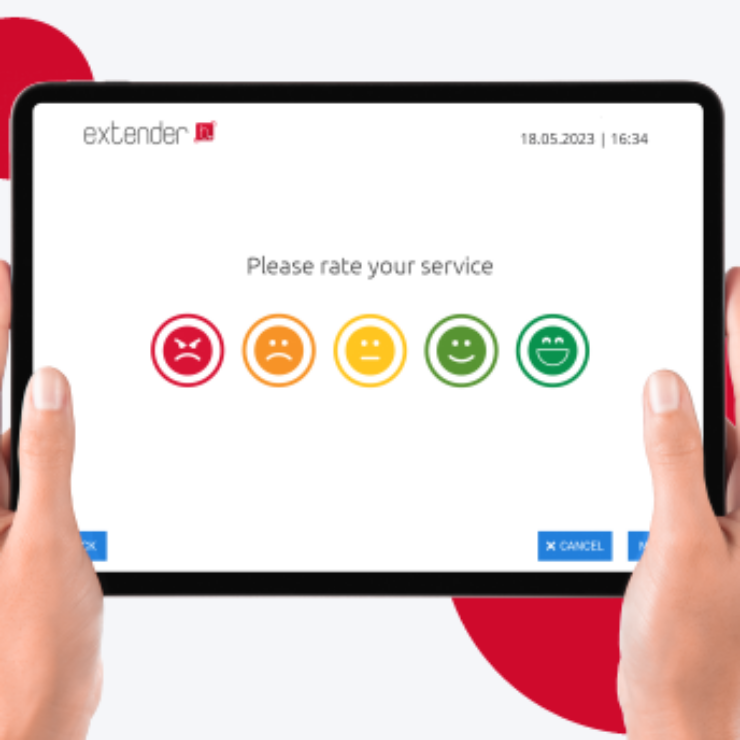
Our system gets and processes all information filled in by customers or staff members during or after the service, displaying satisfaction ratings, specific service feedback, demographic data, or anything you want through customized surveys.
- Customer satisfaction
- Answer submission
- Scale questions
- Single-choice questions
- Multiple choice questions
Remove all sources of your soft spots.
This is the aim of analytics: to eliminate all deficiencies in your business. When you identify the flaws in your service, you can reflect some change! Excel in your area, based on real insights.


